|
Overview
Intel® Cluster Tools assist developers and managers of distributed systems to
obtain the best performance.
Intel® Trace Collector brings the advantages of event-based tracing to
applications in a low-overhead tracing library. It supports MPI, Java, and multi-threaded
processes with and without MPI. The tool is completely thread safe, allowing
tracing of multi-threaded MPI applications. Automatic function profiling is also
now supported on all platforms when the GNU Compiler Collection is used to
compile C or Fortran source code. Intel® Trace Analyzer and Intel Trace
Collector support IA-32 and Intel® Itanium® architectures with Linux (MPICH).
Intel Trace Collector supports the LAM MPI implementation on IA-32 architectures
and HPUX (HP-MPI) and SGI Altix (SGI-MPI) systems on Intel Itanium 2
microarchitectures. Intel Trace Analyzer displays the data produced by Intel
Trace Collector.
Features and Benefits
- Profiling library records distributed, event-based trace data
- Low-overhead and compact data representation provides structured
trace file format (STF)
- Completely thread safe to allow tracing of multi-threaded message
passing interface (MPI) applications
- Easy-to-use application program interface (API)
- Low intrusion instrumentation for MPI, Java, or multi-threaded
applications
- Complements Intel?s offerings designed for developing high-performance
software including compilers, libraries, and Intel® VTune? Performance
Analyzers
- Automatic function profiling supported on all platforms when the
GNU Compiler Collection is used to compile C or Fortran source code
- Global Array programming model allows tracing and performance
analysis of applications
 Graphically Analyze Runtime Event Traces Graphically Analyze Runtime Event Traces
- Event-based tracing tool ? Successful use of Intel Trace
Collector for MPI performance analysis demonstrates the advantages of event-based
tracing compared to exclusively statistical approaches. The timeline display
helps developers visualize the concurrent behavior of parallel applications.
Statistics can be calculated on demand for given time intervals and specific
processes. The tool also brings the advantages of event-based tracing to
non-MPI applications such as Java processes and multi-threaded processes
without MPI. Java function profiling is possible without recompiling the
Java classes. In addition, the traditional Virtual Terminal application
programming interface (VT API) is also available to instrument Java source
code.
- Ease of use ? Intel Trace Collector works as an add-on to
existing MPI implementations. In most cases, using the tool requires
relinking with Intel Trace Collector library. If application-defined events
must be recorded, a recompile may be necessary. The low-overhead
instrumentation limits the perturbation of the application execution,
assuring that the runtime behavior remains fundamentally unaltered.
Experience shows that lessons learned from studying the traces of a run with
Intel Trace Collector invariably lead to improved performance of non-instrumented
runs.
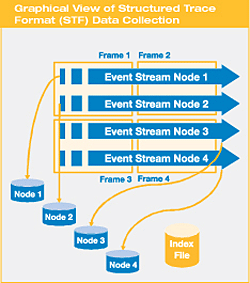
- Structured trace file format ? Intel Trace Collector introduces a
new file format for trace data: the Structured Trace Format (STF). This file
format was designed from the ground up for scalability and compact data
representation. Files can be written in parallel, thus generating trace
files faster, and allows random access to portions of a trace, making it
suitable for analysis of traces too large for Intel Trace Analyzer.
- Scalability and memory handling ? Reduction of large memory
consumption, often associated with event-based tracing, is addressed by the
filtering and memory-handling capabilities of Intel Trace Collector. For
deep function call stacks, folding avoids superfluous details by logging the
first call to a system function and then hiding all internal functions below
this call. Trace data is cached in memory to reduce runtime overhead, but
can be written to a cache file in the background without blocking the
application. Counters can be used to monitor Intel Trace Collector's memory
handling. If that still interferes with the application or simply produces
unneeded data, Intel Trace Collector can be used in a purely statistical
mode. In this mode, statistics regarding function calls, messages, and
collective operations are calculated by Intel Trace Collector at runtime and
stored without event data. Intel Trace Analyzer can display these statistics
instantaneously without having to load any trace data.
- Completely thread safe ? Intel Trace Collector allows tracing of
multi-threaded MPI applications. The tool brings the advantages of event-based
tracing to non-MPI applications by supporting Java processes and multi-threaded
processes without MPI. Java function profiling is possible without
recompiling the Java classes. In addition, the traditional VT API is
available to instrument Java source code. Automatic function profiling is
supported on all platforms when the GNU Compiler Collection is used to
compile C or Fortran source code.
Processor and Data Scalability
Intel Trace Collector easily scales up to several hundred processors due to a
hierarchical approach to address data scalability.
Diverse Hardware and Software Support
Intel Trace Collector supports IA-32 and Itanium architectures with Linux.
MPI implementations such as MPICH, LAM MPI, ScaMPI, and Myrinet MPI are
supported on IA-32 architectures. On Itanium architectures, MPICH, HP-UX (HP-MPI),
and SGI Altix (SGI-MPI) systems are supported. Automatic function profiling is
supported on all platforms when the GNU Compiler Collection is used to compile C
or Fortran source code.
Intel® Premier Support
Every purchase of an Intel® Software Development Product includes a year of
support services, which provides access to Intel® Premier Support and all
product updates during that time. Intel Premier Support gives you online access
to technical notes, application notes, and documentation. Install the product,
and then register to get support and product update information.
|


