|
 A revolution in debugging A revolution in debugging
The Distributed Debugging Tool (DDT) is a comprehensive graphical debugger for scalar, multi-threaded and large-scale parallel applications. DDT puts you in control of your application, whether you are working with a workstation or a thousand processor high-performance cluster.
DDT has the industry's best parallel debugger interface: one screen to control hundreds of processes - all at the click of a button, and supports all major MPIs, OpenMP and queueing systems. The product is incredibly intuitive, with no scripting language to learn, easy to use, powerful and inexpensive. It supports advanced C, C++, Fortran and Fortran 95.
Scalable, versatile, intuitive
- Group processes by task with drag-and-drop
- Run and step processes in groups with real-time visual feedback
- Define breakpoints and synchronization points by group
- Navigate through local variables, stack frame and complex data structures with ease
- View variables on selected program lines in a single window
- Automatic display of project source files with syntax highlighting
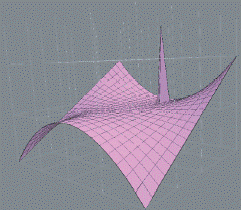
- Visualize slices of multidimensional arrays using OpenGL graphics
- Message queue analysis to detect program deadlock
- Compare values across groups of processes: statistically, graphically and automatically by equivalence
- Attach to running processes, launch MPI jobs through the GUI , or let DDT submit your job to your favourite batch scheduler
- NEW in DDT v1.8: advanced Fortran 95 support, including derived data types, allocatable arrays, modules, character variables and kinds
Compatibility
- Available for a growing list of operating systems, including IBM AIX and Linux on Power, HP-UX, Linux, SGI Altix, SGI IRIX and Sun Solaris
- Support for the latest processors and platforms: AMD64, EM64T, IA32, IA64, Power, UltraSPARC, PA-RISC and MIPS
- Compatible with compilers from all major vendors – including Absoft, IBM, Intel, Pathscale, Portland Group, Sun - and the GNU compiler suite
|


