|
O-Matrix is an integrated environment for analyzing and visualizing data, and
building turnkey scientific and engineering computing solutions. The program
includes hundreds of engineering and statistical functions for solving a broad
range of technical computing problems. Easy-to-use and flexible plotting
commands enable you to rapidly build design prototypes, and implement
sophisticated systems.
The foundation of O-Matrix is a high-performance matrix language that is
specifically designed for high-performance technical computing. The notation of
this language will dramatically reduce your design and implementation efforts,
and enable the construction of systems that execute far quicker than other
interpreted environments. O-Matrix also provides a compatibility mode that
enables you to run MATLAB© m-files. This enables you to leverage existing
m-files, and simplifies the transition to O-Matrix for users experienced with
MATLAB.
The O-Matrix environment is interpreted which means your commands are
immediately executed as you enter them. Textual output is displayed in the
Command window, and plotting commands are displayed in one or more
Graphic windows. The environment provides a debugger for debugging,
analyzing, and profiling complex algorithms.
Plotting in O-Matrix is easy-to-use and flexible for creating presentation
plots.
O-Matrix excels as both a prototyping environment, and a tool
for implementing sophisticated systems. You can use O-Matrix, to perform what if
types of analysis by entering single line commands or scripts and viewing the
results, or you can build extensive, GUI-based systems.
O-Matrix Performance
O-Matrix has been designed from the ground up for accuracy and
high-performance. The O-Matrix environment enables you to both prototype designs
and perform large scale analysis within the integrated environment. O-Matrix has
been built using highly optimized C/C++, FORTRAN, and assembly code to provide
optimal execution performance. The linear algebra routines in O-Matrix are based
on the algorithms from BLAS, LINPACK, and LAPACK to provide robust, accurate
solutions.
O-Matrix Analysis Functions
O-Matrix provides an extensive set of functions for implementing
solutions in a broad range of technical computing disciplines. Functions are
highly optimized and designed to be easy-to-use for prototyping applications and
extensible for specialized requirements. Most functions include complete source
code to allow you to review the implementation and modify it to your own
requirements if necessary. The following function types are available:
- Linear Algebra
- Statistics, Special Functions and Simulation
- Curve Fitting, Optimization and Derivatives
- Fourier Analysis and Filtering
- Integration and Differential Equations
- Polynomials
- Elementary Functions
O-Matrix Plotting and Data Visualization
O-Matrix provides a broad range of functions and tools for
plotting and visualizing technical data. O-Matrix makes it easy to formulate,
test, and explore alternative ideas. Typical plots can be created by entering a
single statement at the O-Matrix command prompt or sophisticated, highly-customized
plots can be generated by creating script files. Plotting script files enable
the easy regeneration of plots for multiple data sets, iterations of a model, or
repeated experiments.
Plot attributes and characteristics such as line thickness, tick
mark spacing and style, layout, font properties, and labels can be customized to
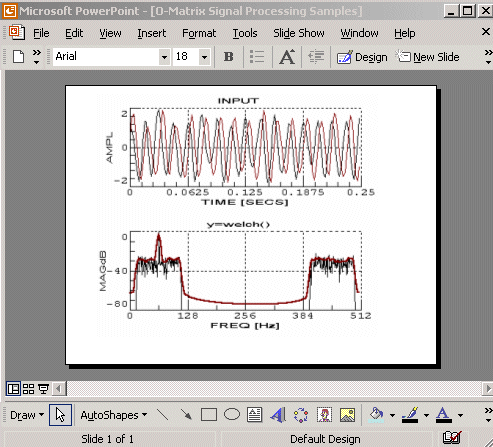
create specialized plots. Plots can be exported as either bitmap or vector-based
images for import into other applications such as Microsoft Word, PowerPoint,
and tools used for journal publication.
2-D Plotting
O-Matrix supports all 2-d plot types that are typically required for
scientific and engineering analysis; all of which can be controlled to create
highly-specialized plots.
-
Line and Scatter plots with single or multiple curves
-
Histograms
-
Vector Plots
-
Bar, Stair, and Bubble charts
-
Smith charts and Polar Plots
-
Filter Response Plots
-
Animations
3-D Plotting and Visualizing Multi-dimensional Data
O-Matrix provides numerous functions for plotting single and multiple
variables in 3-D.
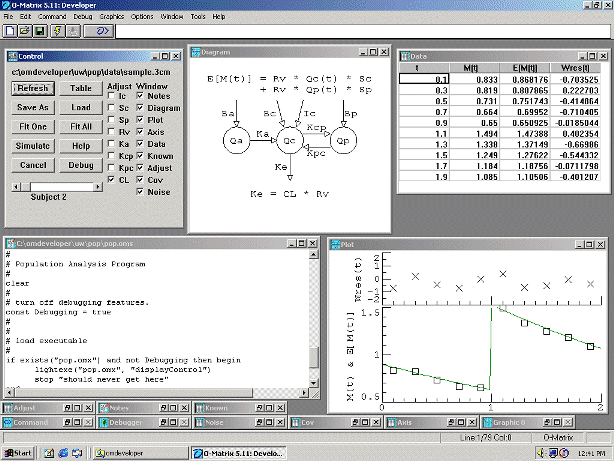
Implementing Algorithms in O-Matrix
O-Matrix provides a simple-to-use, high-performance interpreted language.
Commands can be entered directly at the command line and executed as you enter
them, providing immediate results or commands and user-defined functions can be
entered in text-based files. The syntax of the O-Matrix language is a hybrid of
BASIC, and other matrix languages providing a very easy-to-learn and compact
notation where algorithms are the same as the mathematics they represent.
The O-Matrix language and run-time environment facilitate both rapid,
interactive visual data analysis and the construction of large, sophisticated
applications. Typical end user solutions range from a few commands entered at
the command prompt to thousands of lines of code spanning many files.
Data Access and Manipulation with O-Matrix
O-Matrix provides extensive capabilities for working with data from files,
applications, devices, and databases. Directly load data from formats such as
Excel, text files, HDF, WAV files, and PLT files. Low-level utilities are
provided to enable importing and creation of arbitrary ASCII or binary data.
Using the O-Matrix OLE/COM Automation functions you can leverage the data import
and export capabilities of other applications. O-Matrix can link with compiled
objects from languages such as C/C++ and FORTRAN to enable the use of custom
data input and output routines from within the O-Matrix language.
The O-Matrix data access and manipulation routines are highly optimized and
can efficiently work with data sets that contain hundreds of thousands of data
points and using many megabytes. The import of a multi-megabyte file in O-Matrix
takes a fraction of the time needed by Excel, and is typically much quicker than
the same algorithm implemented in a compiled language.
O-Matrix excels at manipulating and formatting data. Numeric and textual data
can be re-formatted as it is loaded or manipulated after loading. Flexible
routines are provided to enable sophisticated formatting and manipulation of
various data formats.
Building Graphical User Interfaces with O-Matrix
O-Matrix includes functions for creating custom GUIs. Design dialogs with
buttons, popups, checkboxes, tables, bitmap display, grid tables, and other
common Windows controls. Interfaces can be developed in O-Matrix in a fraction
of the time of compiled languages, and provide much better performance than
typical interpreted solutions. Using O-Matrix GUI building capabilities and The
O-Matrix Development Kit users can rapidly develop technical computing solutions
that can be distributed royalty-free.
|