
|
http://www.aertia.com |
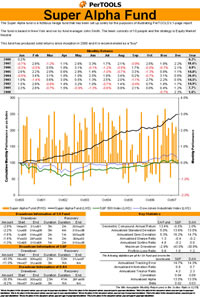
PerTOOLS Financial Analysis for Excelby Totally Un Limited CompanyPerTOOLS Financial Analysis for Excel is an extremely valuable tool for Excel that allows anyone to easily analyse time-series data automatically, with flexibility, speed and full user control.
You can choose from a range of over 50 functions (which includes an infinite number of implementations) each of which runs very quickly and can be called from a cell formula in exactly the same way you might use an Excel formula like All functions refresh automatically when data is added, deleted or changed and you can easily use thousands of these functions in a single spreadsheet without experiencing speed issues. All appropriate functions are supplied in both geometric and arithmetic versions so you can choose how to compound returns. A comprehensive manual is also provided which contains full explanations of all functions together with all necessary mathematical formulae and examples. An example spreadsheet is also provided which shows examples of all functions being used in practice. Full VBA integration is included. The functions have been written so that the user only needs to remember a minimum about how to use them. For example, the function =PT_CumRet_A() that computes an Arithmetically-Compounded Return can produce many different kinds of output depending upon the function inputs. It can produce:
The advantage is that the user doesn’t need to remember many different function names; he just needs to remember one. In this way, fewer functions can have many implementations. All of the functions, manual and example spreadsheet are included for one price. The new UpScaling functionality allows the user to compute any of the PerTOOLS statistics over any period. For example, suppose the user wanted to compute a Sharpe Ratio. No matter what the frequency of the input data is (daily weekly, monthly etc.), the user can compute a daily, weekly, monthly or annual Sharpe Ratio Available functions include:
Uses
Full instructions are provided in a detailed user-guide. |
| Price list | |
| PerTOOLS Financial Analysis for Excel | 1.250,00 € |
© 2004, Aertia, S.L. |
|
 PerTOOLS Financial Analysis for Excel is an extremely valuable tool for Excel that allows anyone to easily analyse time-series data automatically, with flexibility, speed and full user control.